Lab 3 Part B
Microsoft Word
Objectives:
- Learn how to insert images and captions into a document
- Learn how to make a table of contents
- Learn how to format text
- Learn how to add footnotes and page numbers
What is Microsoft Word and Why Should I Use It?
Microsoft Word is a word processing application. As a promising Tech student, you will need to use Word more than you probably want to. Your English professor is only the first of your worries. You will be cornered into writing formal reports in all too many engineering classes, so you might as well learn how to make them look snazzy.
Before you begin, download the Bad Persons Report
HERE and open it using Word.
(Note: in some browsers you will have to right-click on the link and select
'Save Target As'). This will be the document you will edit and turn-in to
T-Square before the deadline.
The Assignment
You will put the following items into the report:
1. Fill in the blanks in the report
2. An appendix that contains the Excel spreadsheet from part A
3. All plots from part A of the lab
4. Add figure captions to the plots and cross-references in text
5. A table of contents that can be automatically updated
6. Page numbers at the bottom of the pages
7. Footnote about the data
Instructions in bold indicate specific things that you need to put into lab3report.
Filling in Information
In the lab3report document, some of the results of the analysis have been left blank. Please fill in the blanks with the results with the completed spreadsheet from part A.
Appendix:
With technical reports, you often have a lot of
data and tables containing data that are pertinent to the report, but just too
detailed for the average reader. You stick this type of "scratch
work" into the appendix, so that interested parties are privy to your data
and intermediate results, but spare the average reader from having to wade
through tons of data to get to your point.
Add an Appendix section to the end of the lab3report document. Paste into
the appendix all the spreadsheet data that you worked with in part A of the
lab. You can do this by highlighting the cells in Excel that you wish to
include and then selecting "Copy" from the "Edit" menu. In Word, click on the Appendix page where you want the data table
to appear. Click on "Paste" from the "Edit" menu in
Word.
Inserting Plots:
If you choose to insert a plot you drew in Matlab, you can copy the plot by going to the figure window and selecting from the "Edit" menu "Copy Figure."
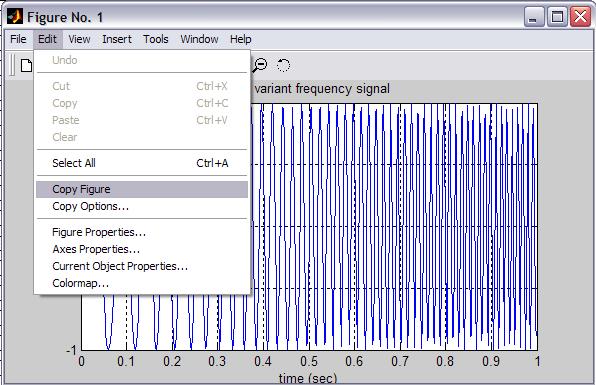
Figure 1: Copying figures from Matlab.
Similarly, you can click on the Excel plot you created in part A and selecting
"Copy" from the "Edit" menu in Excel. Now go back to your
document and place the cursor where you would like the plot to appear. Go to
the "Edit" menu and select "Paste" (or hit CTRL-V) to paste
the plot into your report. After your picture appears in the body of the
report, make sure you give it a figure number and a short caption. It's rude
(and unprofessional) to leave a picture orphaned and naked in the middle of a
page! For this lab, you will need to paste all the plots you created in part
A of this lab into the Data Analysis section of lab3report. Be sure to include
figure numbers and captions.
Inserting Captions and Cross-Referencing Them:
To avoid doing the figure captioning by hand, we will use Word's built in captioning system. The benefit is that when you delete or add figures as your report goes through revisions, the figure captions and numbering will take care of themselves. So, for example, when some figure goes from being figure 2 to being figure 3, you don't need to read through your entire report and change the text where you say something like "please refer to figure 2..." to "please refer to figure 3..." This referencing is done for you! How to set this up?
Click on the picture you which to make a caption for. Go to "Insert" and click on "reference" and then "caption." Under the "Label" pull down menu, select "figure." Then type in what you want your caption to say and hit "OK." Now, when you're ready to make a reference to your image in the body of the text, you simply place your cursor at that point in the text and go to the "Insert" menu once more. Select "Reference" and then "Cross-reference." A window should pop up. Under reference type, select "figure" and under insert reference to, you can choose either to only mention the figure number, or have the figure and the figure caption text pasted into the document.
Creating a Table of Contents, The Easy Way
In the days of yore, writing a table of contents involved flipping through the report, tracking down where each section starts, and then typing the information in. If we added a new section, inserted additional paragraphs, images, etc. after the table of contents was created, well, you had to redo some of the work. However... Word is smart enough to be able to recognize and remember where each section and sub-section starts. All you have to do is format your document, and the rest of the work is done by Microsoft.
Formatting Your Document
In order to be able to get Word to recognize where each section begins, you need to indicate levels of text. In most cases, Level 1 text defines a main section of the report, and Level 2 text defines subsections. In the figure below, we've shown how to get to the Outline view, where all the levels of text gets specified. Highlight the words you want to serve as your section title, and then on the drop down menu at the top left of the screen, select "Level 1." If you have sub-sections, you can highlight the sub-section titles and set them as "Level 2" in a similar fashion.
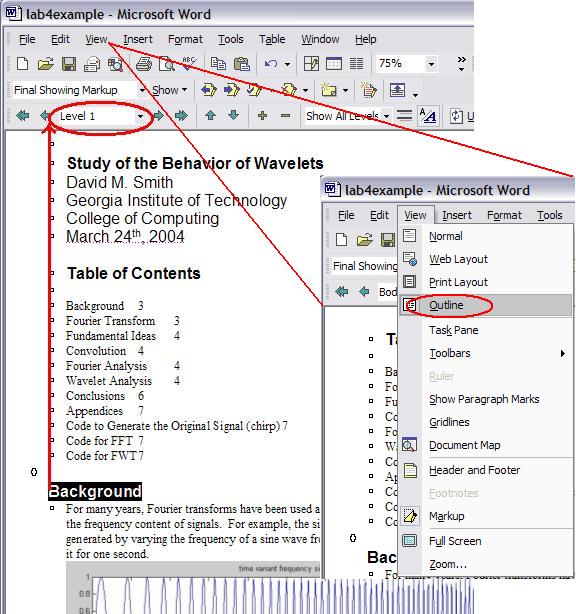
Figure 2: Formatting text in outline view.
Now that you have the text properly formatted, you need to insert a table. Go to the "Insert" menu and click on the "Reference" submenu. Select the option called "Index and Tables...". You should see a window pop up that looks like the one shown in figure 3.
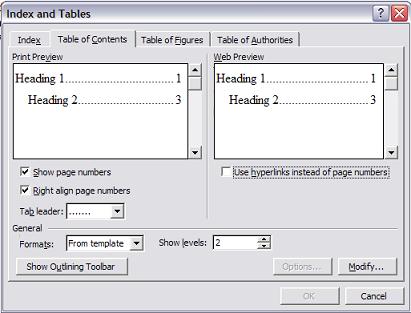
Figure 3: Index and tables formatting window.
Notice towards the bottom there's a peculiar field where you specify how many levels to show. As in the "Study of Behavior of Wavelets" example, we had two levels of text: main sections and sub-sections. That makes a showing 2 levels in the table of contents appropriate. For this lab, the Introduction, Data Analysis, Conclusion, and the Appendix headings should be made level 1.
Inserting Page Numbers
Page numbers are useful to have, particularly when you distribute paper copies of your report. To get Word to automatically insert page numbers, go to the "Insert" menu and select the "Page Numbers..." item as shown in figure 4.
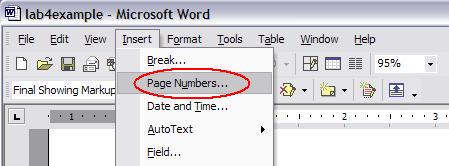
Figure 4: Insert page numbers.
By double clicking on the page number you can edit the page number. You can adjust where the page number appears on the pages with the two pull down menus. However, for more detailed options, click on the "Format..." button. You should see a window pop up that looks like the one shown in figure 5.
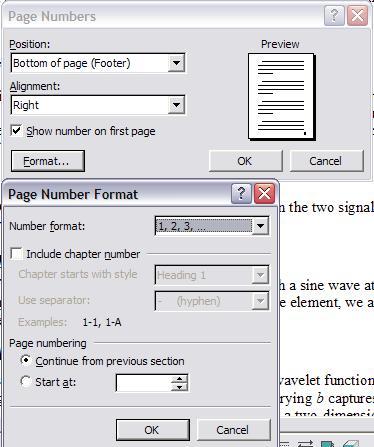
Figure 5: Page number formatting screen.
Play around with the options and see which styles you like best. For this
lab, just make sure you insert page numbers somewhere on the bottom of the
page.
Inserting Footnotes for References
Since you didn't use data that you obtained personally, you need to reference the source. Any information you include in a report that is not your own work needs to be referenced. This is sometimes done with footnotes.
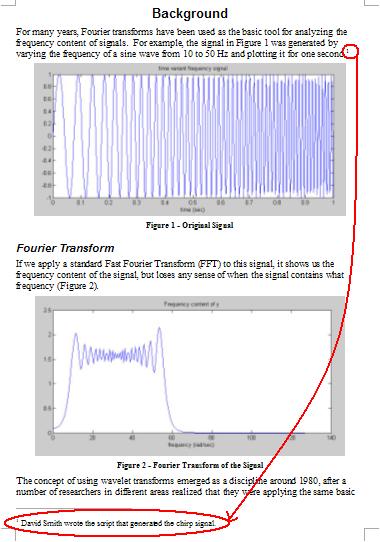
Figure 6: Example footnote.
To insert a footnote, position the cursor right after the first sentence under the Data Analysis section. Go to the "Insert" menu, find the "Reference" sub-menu and select "Footnote..." A window will pop-up to allow you to customize the appearance of your footnotes. For this lab, you just need to make sure your footnote is "Continuous" and appears at the "Bottom of Page." Be sure to give credit to The National Gangsta Database and Spreadsheet Co. Ltd. for the data. (See figure 7 below). You can customize the rest to suit your tastes.
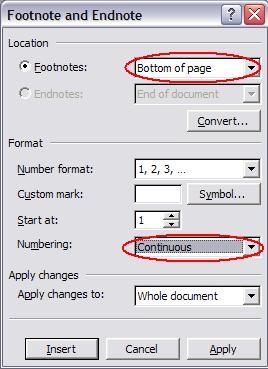
Figure 7: Footnote formatting window.
Checklist of Requirements:
- Fill in the blanks in the report
- An appendix with the Excel spreadsheet you completed in part A.
- All plots from part A of the lab.
- All plots have cross-referenced captions.
- A table of contents that can be automatically updated.
- Page numbers at the bottom of the pages.
- Footnote in the Data Analysis section.
- Turn in the "lab3excel.xls","lab3report.doc" and "lab3SAT.xls" files through T-Square (yes, exactly that name).
- RETRIEVE your submission and make sure it is correct.
- Did you retrieve it? We're not kidding! Do it now!
Last Modified: November 17, 2008